Chapter 3 General approach to a patient with electrolyte disturbance
In the following chapters, we will consider specific electrolyte or acid-base disorders. However the clinical approaches to these very different disorders have much in common.
For any disturbance in electrolyte or acid-base homeostasis it is usually worth starting with a few basic questions:
is there a history of vomiting, diarrhoea (or other gastrointestinal losses - e.g. biliary drains)?
what is the current volume status / effective arterial blood volume (EABV)?
are there any potential culprit drugs - including IV fluids?
what is the diet?
3.1 Vomiting & diarrhoea
3.1.1 Electrolyte content of body fluids
| source | Na | Cl | K | H | HCO3 | consequence |
|---|---|---|---|---|---|---|
| vomiting / NG | 60 | 140 | 10 | 80 | - | hypochloraemic hypokalaemic alkalosis |
| bile | 150 | 100 | 5 | - | 40 | |
| diarrhoea / colostomy | 30 - 140 | 60 | 30 - 60 | - | 40 - 80 | |
| high-volume ileostomy | 100 - 140 | 75 - 125 | 5 | - | 0 - 30 | |
| low-volume ileostomy | 50 - 100 | 25 - 75 | 5 | - | 0 - 30 | |
| pancreatic | 140 | 75 | 8 | - | 100 | |
| jejunal | 140 | 135 | 5 | - | 10 | |
| fever / dehydration / hyperventilation | - | - | - | - | - | hypernatraemia |
| polyuria | variable | variable | variable | - | variable | |
| chyle | 140 | 105 | 5 | - | 25 | electrolytes similar to plasma; loss of fat-soluble vitamins |
All values are in mM; data from FLUID THERAPY and disorders of electrolye balance, WH Taylor, 1970; (Gennari & Weise, 2008) & NICE Guidance on IV Fluid Therapy, 2017.
3.1.2 Vomiting
The consequences of vomiting are reasonably complex (Galla, 2000; Gennari & Weise, 2008; Luke & Galla, 2012).
Normal stomach acid physiology. When H\(^+\) is secreted by gastric parietal cells, HCO\(_3\) is returned to the blood (the ‘alkaline tide’). Low pH in the duodenum is sensed by S-cells > stimulates secretin > HCO\(_3\) secretion by pancreas (with return of H\(^+\) to the bloodstream). The alkaline pancreatic secretion neutralises stomach acid in the GI tract and the H\(^+\) return to bloodstream counteracts the stomach’s ‘alkaline tide’, so no net effect on systemic pH.
Generation phase of alkalosis. After vomiting, H\(^+\) is lost from the body and so pancreatic secretions are diminished. Therefore the alkaline tide not counterbalanced by duodenal-pancreatic unit and a systemic alkalosis is generated.
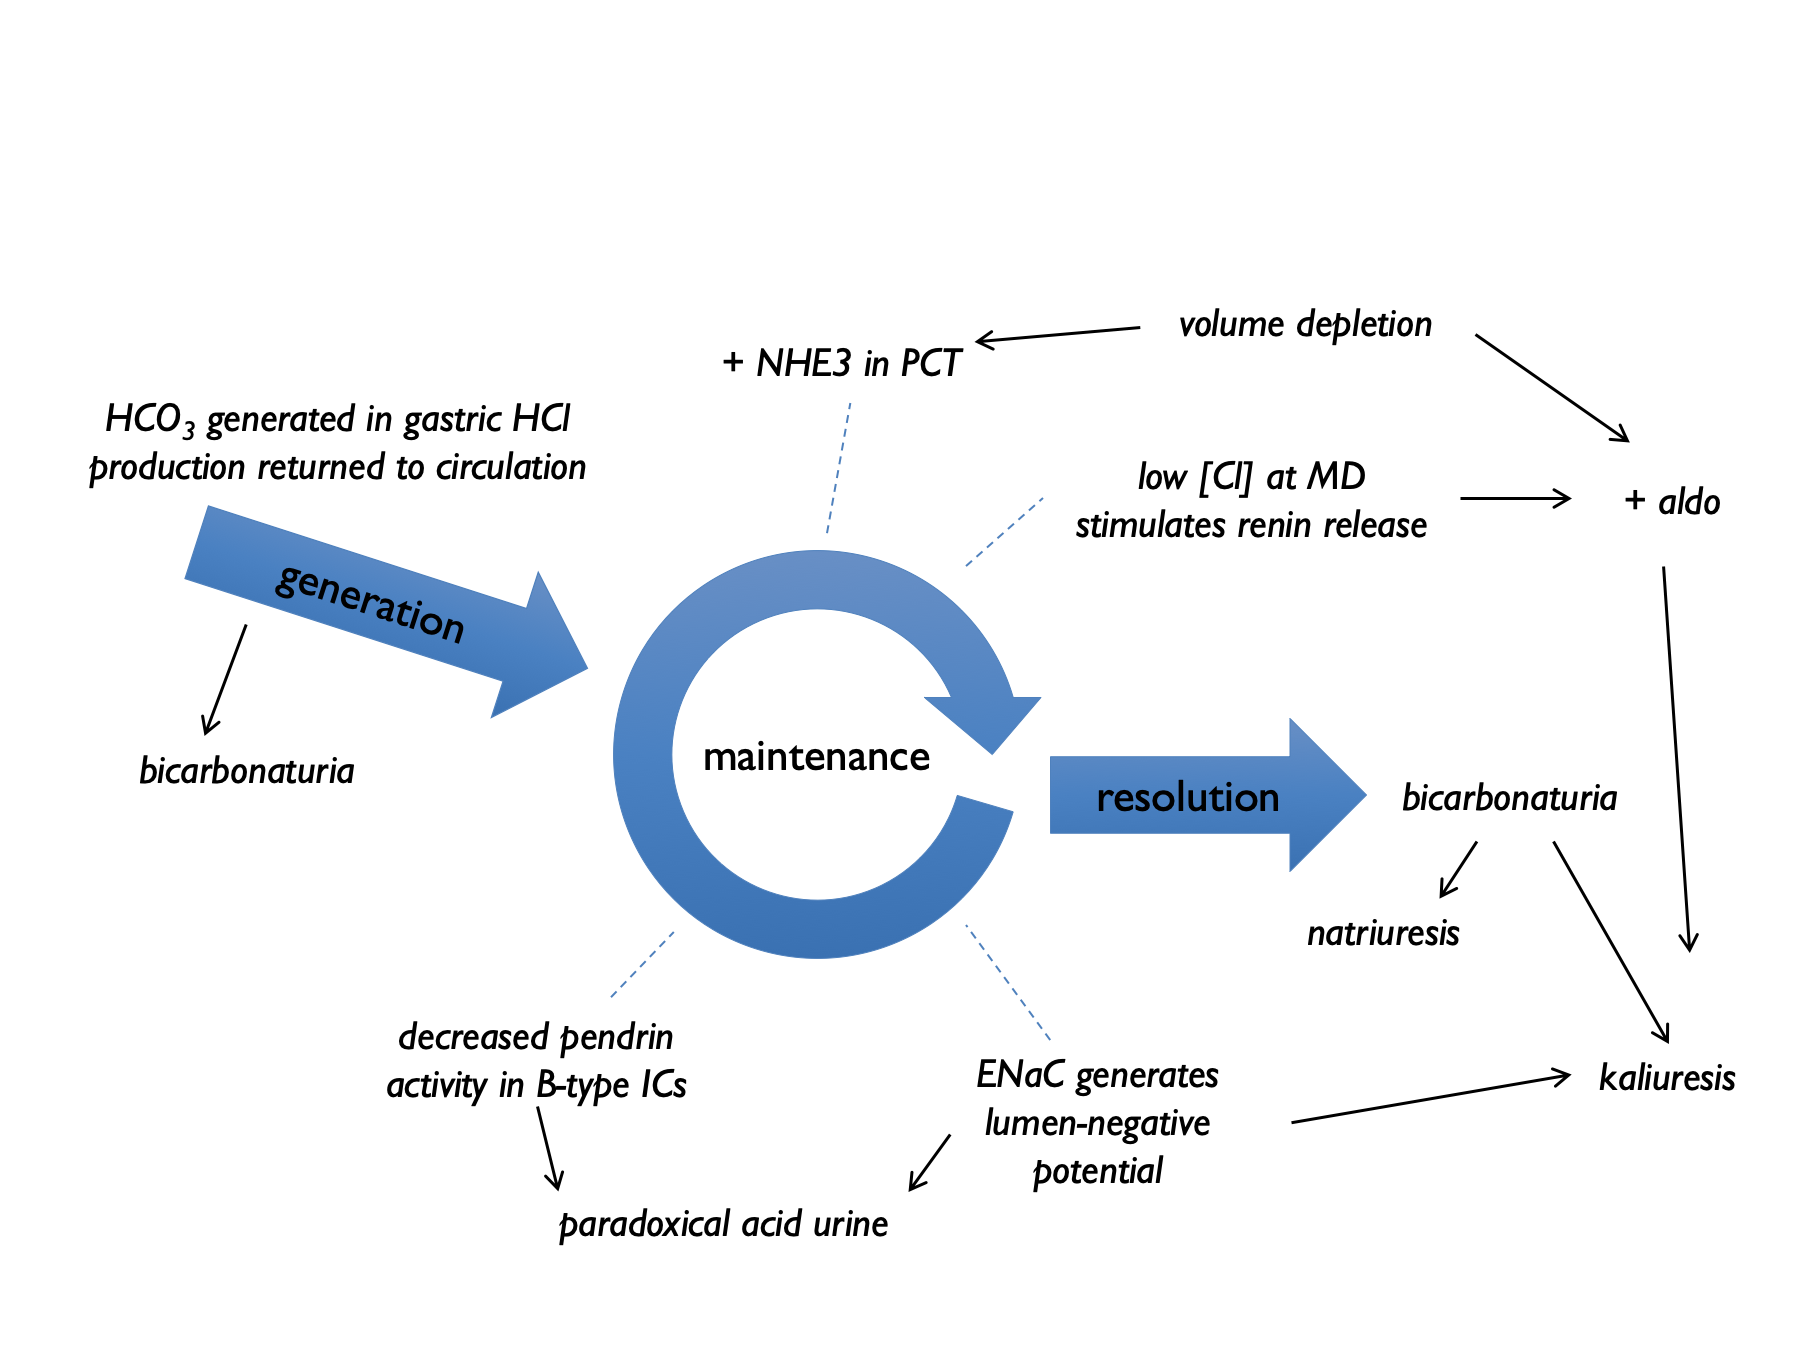
Maintenance phase. Several renal tubular processes act to sustain the metabolic alkalosis. These are indicated by the numbers in the diagram below:
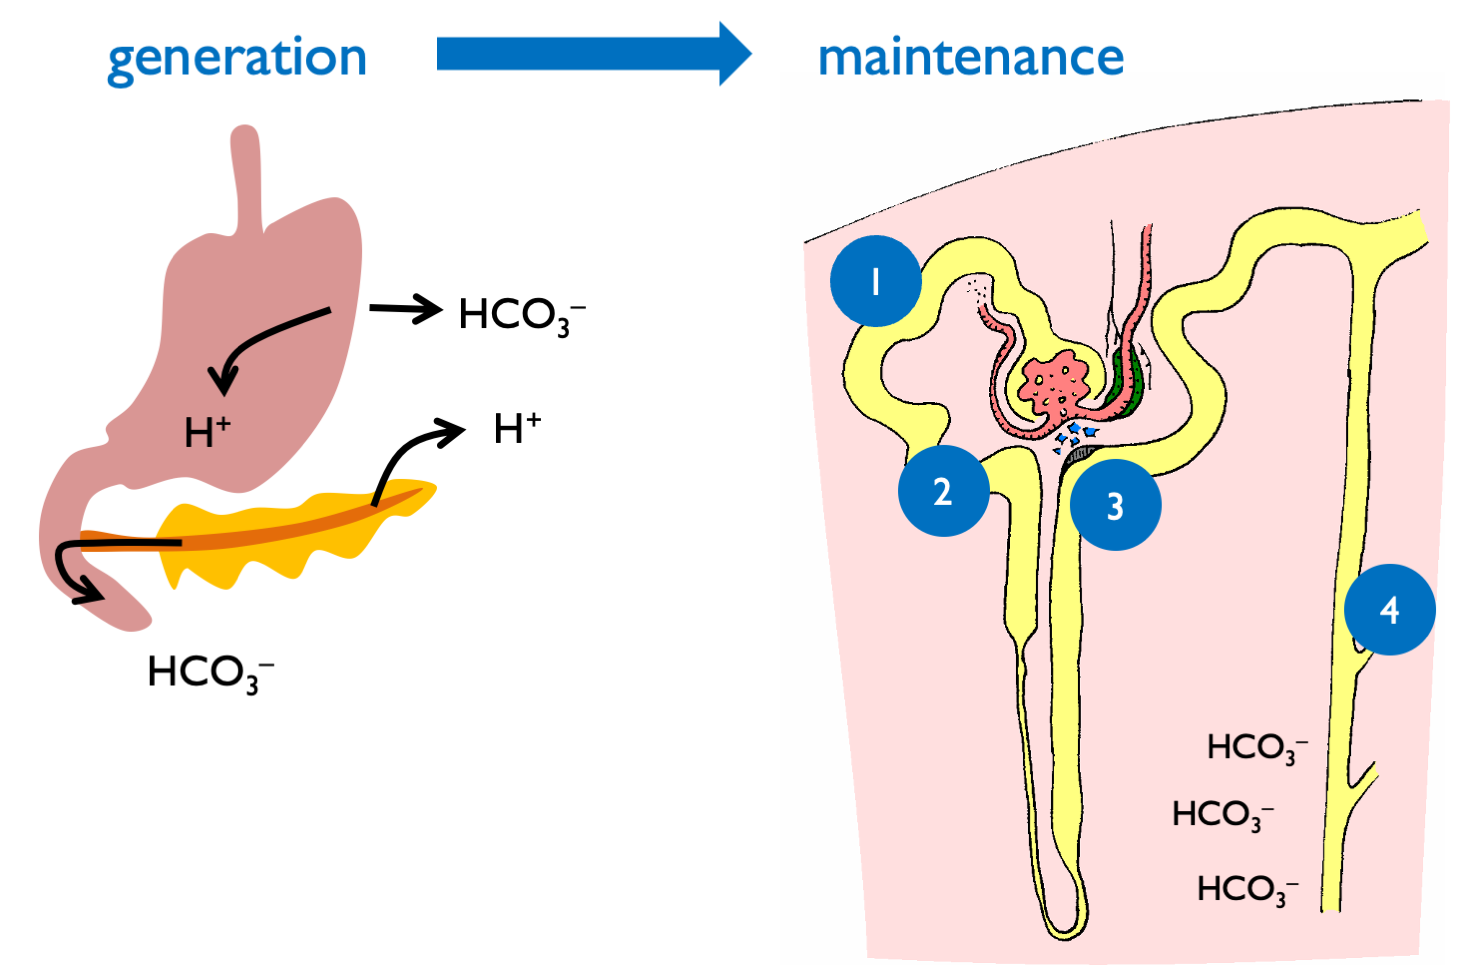
- volume depletion > AngII > increased NHE3 activity (and hence increased HCO\(_3\) reabsorption)
- hypokalaemia > stimulates ammoniagenesis (and hence increased HCO\(_3\) production)
- low [Cl] at MD stimulates renin release > aldosterone > enhanced H\(^+\) and K\(^+\) secretion
- lack of distal tubular Cl limits Cl/HCO3 exchange by pendrin and hence stops HCO3 secretion by B-type intercalated cells
…and sometimes also low GFR limits HCO\(_3\) filtered load.
This results in a paradoxically acid urine, with bicarbonaturia driving kaliuresis.
UCl more reliable indicator of cause (and saline-responsiveness) than UNa or UK because of bicarbonaturia (+/- secondary hyperaldosteronism).
Burton Rose described two phases of the renal response to vomiting:
- early (< 3 days) : pH > 6.5, high Na, high K, low Cl, high HCO3 (all high except chloride)
- late (day 4+) : pH < 5.5, low Na, low K, low Cl, low HCO3 (all low)
Early after vomiting, metabolic alkalosis means that XS HCO3 is filtered, and the kidney cannot reabsorb this. Therefore bicarbonaturia drives natriuresis and kaliuresis (from increased distal Na delivery +/- volume contraction simulating aldosterone). By day 4, the kidney has upregulated ability to reabsorb HCO3, so natriuresis and kaliuresis abates, with paradoxically acid urine.
The consistently low UCl is helpful when distinguishing vomiting from salt-losing nephropathies: a FECl < 0.5% suggests vomiting or purging.
3.1.3 Quantitative assessment after vomiting
One entertaining exercise is to use the extent of any metabolic alkalosis to estimate the volume of vomitus (Kamel et al., 1990). The volume of distribution of bicarbonate approximates to total body water, TBW (9.1) (Sabatini & Kurtzman, 2009). Therefore we can calculate:
Then assuming that the net loss of gastric HCl (in mmoles) is equal to the net gain of bicarbonate (in mmoles) and that vomits contains ~100 mM HCl, we can calculate that:
This will of course under-estimate the true volume of vomit as it does not take into account bicarbonate loss in the urine.
3.1.4 Diarrhoea
The consequences of diarrhoea are more straightforward. GI losses of bicarbonate and potassium tend to give rise to a metabolic (hyperchloraemic) acidosis and hypokalaemia (Gennari & Weise, 2008).
Chronic laxative use may not be disclosed. Clinical features include:
- finger clubbing (senna)
- melanosis coli (senna)
- ammonium urate stones (radiolucent but visible on CTKUB) - thought to arise from the combination of ammoniagenesis in response to chronic acidosis, acid urine (decreasing urate solubility) and volume depletion (concentrated urine)
3.2 Drugs
Many drugs can affect renal electrolyte handling. Some will be obvious (e.g. renin-angiotensin system inhibitors and diuretics); some are less so. It is worth paying particular attention to antimicrobial agents (Zietse et al., 2009), anti-virals, PPIs and chemotherapy. Ask about drug exposure in the past; drugs such as cisplatin or lithium can cause changes in renal electrolyte handling that persist for many years.
3.3 IV fluids & electrolyte supplements
0.9% NaCl can induce a hyperchloraemic acidosis.
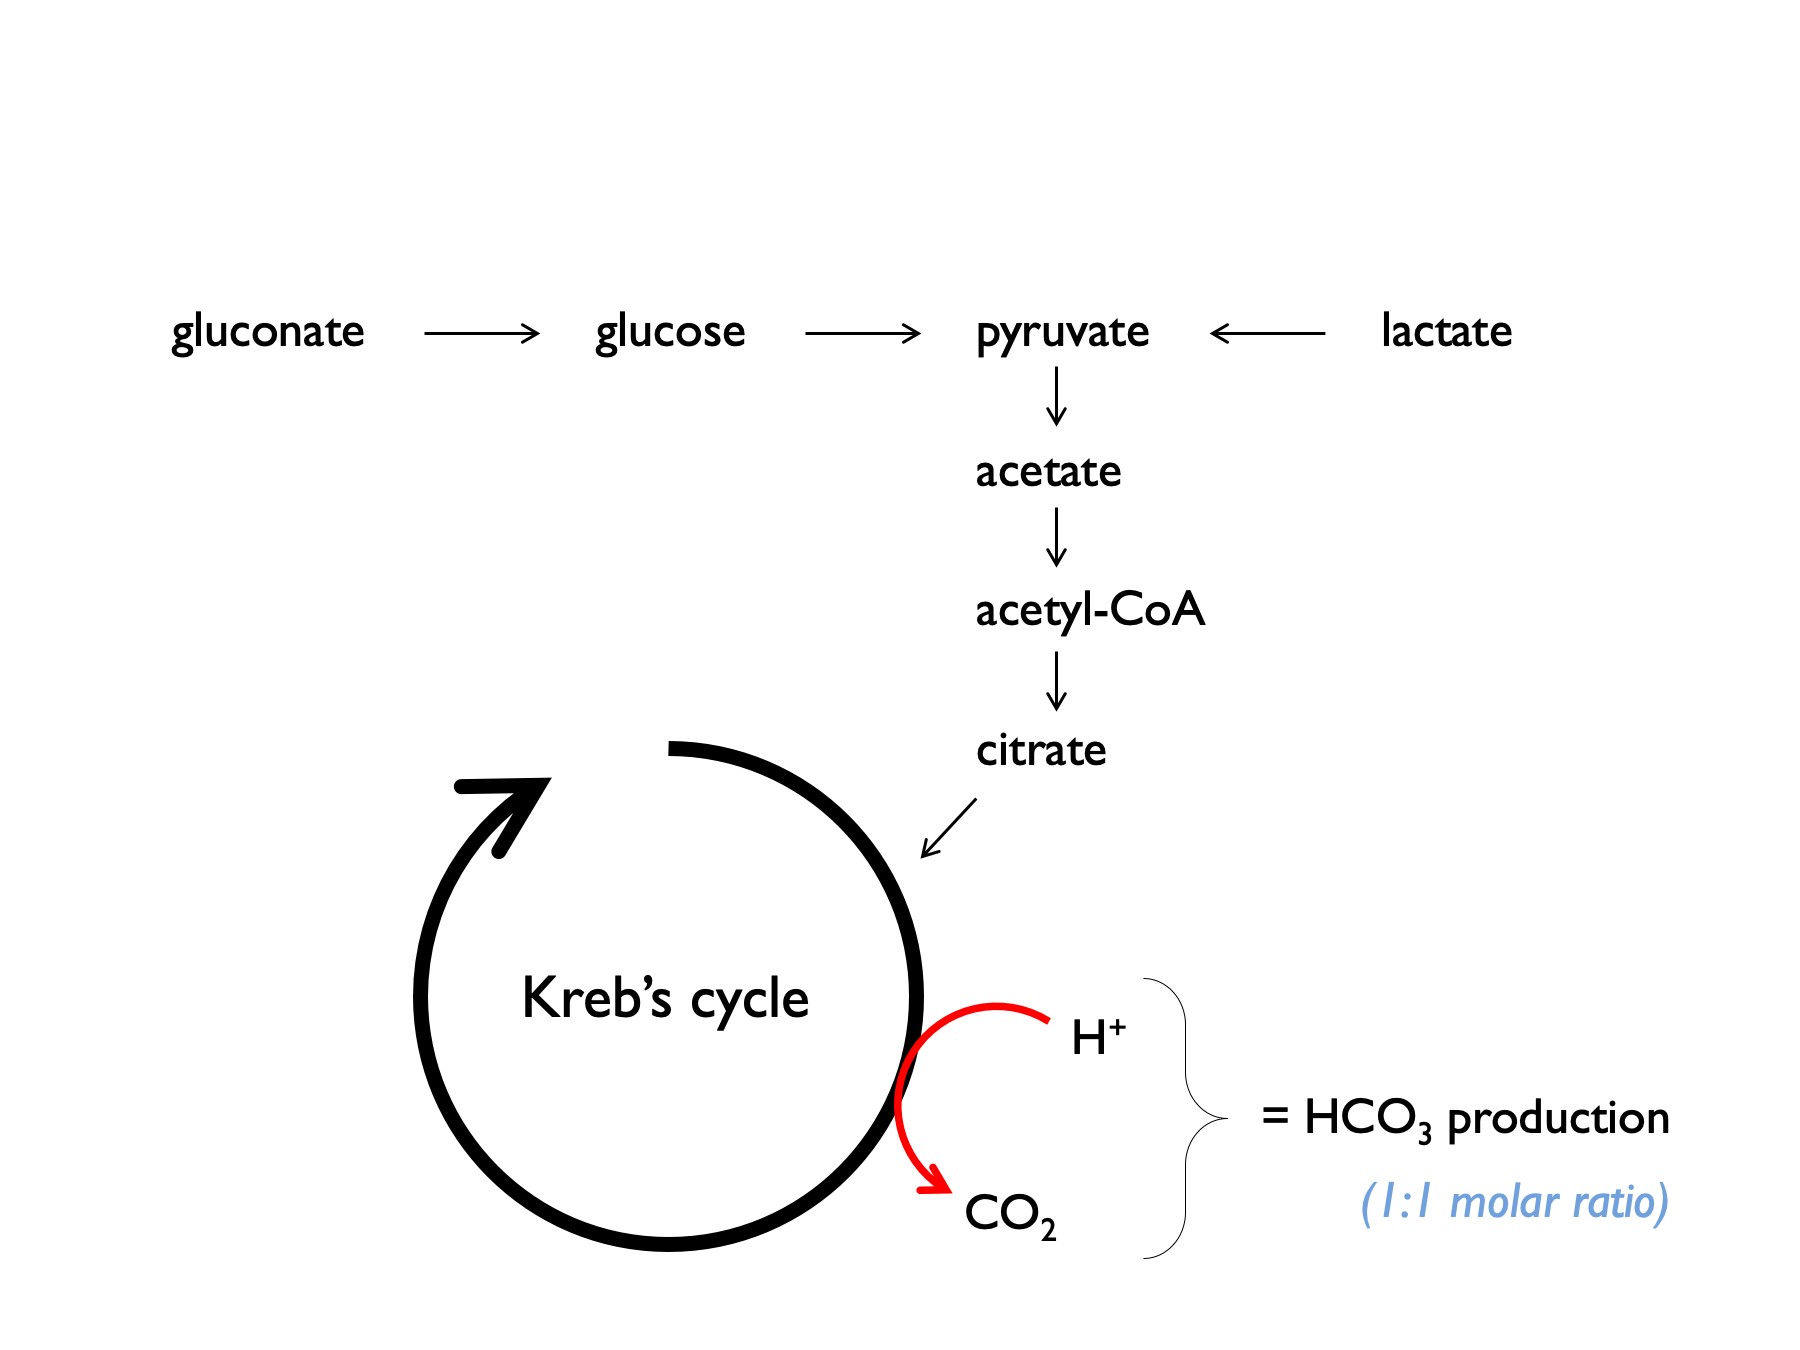
Balanced crystalloids contain lactate, acetate or gluconate, which are metabolised to bicarbonate. Plasmalyte-148 contains 27 mM acetate and 23 mM gluconate = 50 mM bicarbonate-equivalents.
It can be helpful to consider electrolyte supplements in the context of normal dietary intake:
| source | Na | K | Cl | HCO3 | urea |
|---|---|---|---|---|---|
| typical daily Western diet | 160 | 60 | - | - | - |
| WHO daily recommendations | < 90 | > 90 | - | - | - |
| total body K (50 mmol per kg) | - | 3000 | - | - | - |
| requirements in Gitelman | >300 | - | >300 | - | - |
| 1L 0.9% NaCl | 154 | - | 154 | - | - |
| 1L plasmalyte-148 | 140 | 5 | 98 | 50 | - |
| 3 tabs slow sodium tds | 90 | - | 90 | - | - |
| 2 tabs sando-K tds | - | 75 | 48 | 24 | - |
| 2 tabs slow K bd | - | 32 | 32 | - | - |
| 10 ml K citrate bd | - | 60 | - | 24 | - |
| 20 ml Kay-Cee-L tds | - | 60 | 60 | - | - |
| 1g NaHCO3 tds | 36 | - | - | 36 | - |
| 1L 1.26% NaHCO3 | 150 | - | - | 150 | - |
| 50 ml 8.4 % NaHCO3 | - | - | - | 50 | - |
| 10g protein | - | - | - | - | 50 |
NB the values (all mmoles) in the table above are very approximate; HCO3 refers to bicarbonate or bicarbonate-equivalents (i.e. substances that will be metabolised to bicarbonate).
K citrate often preferred to HCO3 (either as NaHCO3 or in sando-K) for long-term supplementation in RTA for at least 6 reasons:
- rational treatment to correct both hypoK and acidosis;
- both the K and the citrate will correct hypocituria (and reduce stone risk);
- will avoid a sodium load (in NaHCO3) which could theoretically increase UCa and increase stone risk;
- bicarbonate can be poorly tolerated as it is converted to CO2 in the stomach, causing bloating;
- as citrate is a ‘pro-drug’ (relies on hepatic conversion to HCO3), may extend half-life;
- liquid forms are more concentrated than HCO3.
Conversion of citrate may be impaired in liver disease.
K citrate liquid is unpalatable. Recommendations to improve palatability include diluting with a glass of water / lemonade / apple juice and following dose with a large volume of water, drinking chilled, using a straw and / or adding artificial sweeteners. Rinse mouth afterwards (but avoid brushing for 30 mins). Take after meals. Effervescent, wax-embedded cystals or granules are alternative solid forms.
Potassium citrate liquid (5 ml) has same composiation as one Effercitrate tablet: K citrate 1.5 g plus citric acid 0.25 g. This delivers approximately 14 mmol K and 6 – 8 mmol citrate. (If you do the maths is 6 mmmol but effercitrate product documentation says 8 mmol).
Various “Lemonade therapies” have been tested as potential home remedies. Lemon juice will deliver citrate but not much potassium (which might be important - see above). A typical starting dose is 60 – 120 ml lemon juice per day (very approximately 30 – 60 mmol citrate). Studies comparing to K citrate supplements are small and have variable results, but overall suggest that “lemonade therapy” can increase urinary citrate but to a lesser extent than K citrate supplements. Adherence is limited (due to poor tolerability) and definitive evidence of efficacy at preventing stones is lacking. See here, here and here.
3.4 Diet
Meat-based diets generate acid. H+ production is approximately 1mmol/kg body weight on an omnivorous diet. A diet based on fruit and vegetables will generate a net alkali load (Kamel et al., 1990).
3.5 Basic set of investigations
Ideally, investigations should be targeted to address a specific clinic question. However, electrolyte disorders can be confusing and there is not always time to think things through thoroughly at the time of initial assessment. A general set of investigations that are useful in most circumstances are given in the box below. Ideally these should be sent before any therapeutic manoeuvres that might alter the results (e.g. IV fluids).
In particular, extreme caution should be used when interpreting any tests send from critical care as patients are nearly all treated with high-dose IV fluid-electrolyte supplements. (This may account for the apparent high prevalence of RTA in patients on ITU.)
If in doubt, send the following samples and think about it later:
- Blood for:
- U&Es
- HCO3 (sometimes called TCO2)
- Cl–
- glucose
- albumin
- osmolality
- U&Es
- A spot urine sample for:
- Na+
- K+
- Cl–
- osmolality
- creatinine
- Na+